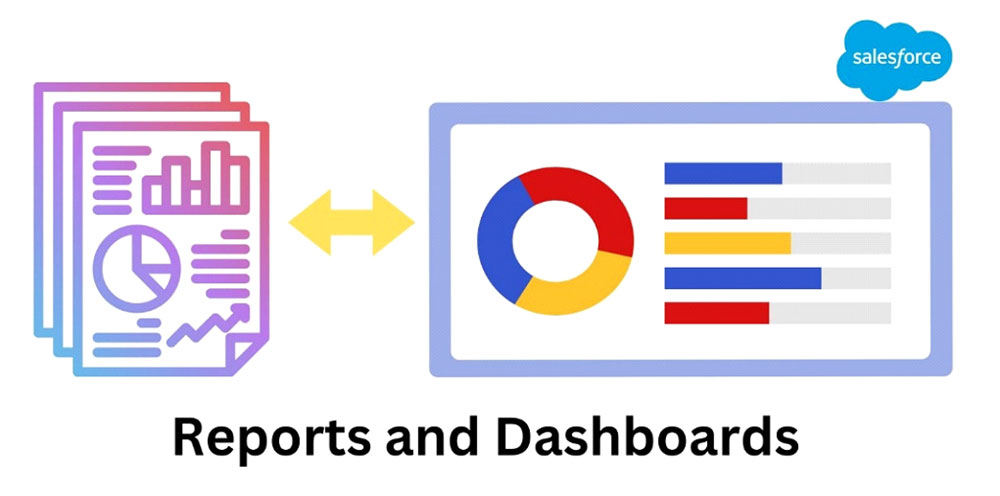
Salesforce provides a strong set of reporting capabilities that operate in concert to make it easier for you to comprehend and use your data. The analytical part of the CRM is represented through Salesforce reports and dashboards. They are used to translate business requirements into visually appealing representations like graphs, pie charts, tables, scatter plots, gauges, metrics, funnel diagrams, and so on.

Salesforce provides a variety of reports that are ready to use right out of the box, but users also have the option to design their own report types. Even more insights into your Salesforce data may be provided by creating your own custom reports.
Your Salesforce reports are shown visually on Salesforce dashboards. They enable you to examine your critical KPIs in a variety of ways.
Salesforce Reports
The customization of Salesforce reports is extensive. Reports can be used by various user categories for a variety of purposes. For example: Users in sales can see their account and opportunity data, while users in marketing can see their lead and campaign data. To track login history, user profiles, and other information, administrators may run a report in Salesforce on users.
Basic characteristics of Salesforce reports
Salesforce Dashboards
Salesforce dashboards may be created in both Classic and Lightning and are quite customizable. The intricacies of creating reports and dashboards in Lightning will be covered in this post, but links have also been provided for the same processes in Classic.
In an ideal world, every Salesforce user group would have a dashboard with their key performance metrics visible. Because you can see the data in black and white on a dashboard, accountability within teams can be improved.
Key characteristics of Salesforce dashboards
Difference between Reports and Dashboard
A report is just a set of data points or records that have been created using the criteria that you provide. Reports will be shown in rows and columns in Salesforce. By filtering them or combining them with other data sets, you may improve reports.
Every Salesforce report is kept in its folder. By creating custom permissions, you can restrict who has access to certain reports. Reports may be shared, made public, or kept private.
The dashboard shows this data visually, whereas Salesforce reports show it in columns and rows. Each dashboard element shows information from a particular report. Data from a single report is shown in each component of the dashboard. Nothing will reveal information from several reports.
However, there are several dashboarding technologies that you may use to examine a Salesforce report. For example, you may create pie and bar charts using the report data. The Salesforce interface offers a lot of customization options. Several dashboard features may be added to your page.
This adaptability enables you to quickly assimilate the data from a variety of Salesforce reports that contain relevant information.
Benefits of creating Reports and Dashboards in Salesforce
Reports allow you to focus more on your business while saving you time and money
The Salesforce reports enable various businesses to subscribe to the already developed, adaptable, and on-demand services without having to pay the high maintenance fees or other costs associated with the lengthy, difficult, and expensive process involved in creating a large corporate vision of Salesforce.
Because of Salesforce’s design, it is possible to lower overall ownership costs, spend less time, reduce risks, and focus more on business management than technology.
Reports provide real-time statistics and analytics, as well as contract administration functionality
By simply decreasing the approval periods for contract renewals sooner, it essentially enables various businesses to control the lifecycle of the contract while also saving on contracts and administrative costs.
Information about contracts, such as assessments, terms, and conditions, is better managed and tracked thanks to Salesforce reports. Users get access to the data to assess the company’s historical performance, highlight its flaws, and identify its strong points to address its inadequacies.
It is both adaptable and comprehensible
You may completely customize these reports in Salesforce, even down to the color of the bar graph you want for the analytics report. Most websites will work with you to create the unique application that you desire. However, Salesforce reports are easier for most users to grasp because they cost less to deploy than many CRM applications that are widely available online.
Latest Insights
Salesforce dashboards ensure that business users stop using outdated data. The dashboards offer the most recent information on patterns and trends in sales and marketing.
Simple to Use
Setting up a Salesforce dashboard won’t take a business user long. Salesforce offers business users an easy, rapid procedure for creating dashboards.
Ability to customize
It’s doubtful that the Salesforce dashboards used by a company’s sales team and marketing department would be identical.
Identifies issues quickly
Professionals in sales and marketing are always looking for new methods to spot and address potential issues before they get out of hand. Salesforce dashboards now provide business users the ability to keep an eye on sales and marketing data, spot possible problems before they arise, and take fast action to solve them.
Significant Business Improvement
Salesforce dashboards are perfect for sales and marketing professionals that want to help a business stand out from the competition.


